When Is a Function Decreasing? Solve It with Derivatives
A curve is decreasing on an interval when its y-values fall as x moves from left to right. In the usual A-Level method, find the derivative, then solve where it is negative. The crucial distinction is between the curve lying below the x-axis and the curve moving downhill: those describe different things.
Turn the words into a mathematical test
To find open intervals where the gradient is negative, solve . The inequality concerns the derivative, not y itself. A curve can be above the x-axis and still be decreasing. It can also be below the axis while increasing. Draw a short downhill line above an axis if you need to separate the two ideas. The position of the graph and the sign of its slope are independent.
Find the boundaries before testing intervals
Differentiate first, then solve to find stationary x-values. Also note any points where the function or derivative is undefined; those can split the domain into further intervals. Between consecutive roots of a continuous derivative, its sign cannot change without passing through zero. That is why one test value in each such interval is enough for the polynomial example below.
Read a sign chart correctly
Put the boundary values in increasing order on a number line. Choose one x-value from each interval and substitute into the derivative. Record positive, negative or zero. For a product of two factors, check the sign of each factor, then multiply the signs. Do not pick a test value equal to a boundary: that gives zero and tells you nothing about either neighbouring interval.
Why we use strict inequalities in the answer
At a stationary boundary, the gradient is zero, so that x-value is not a solution of . For the standard exam question asking where the gradient is negative, give open intervals. The broader mathematical definition of a strictly decreasing function can still include an isolated point with zero derivative, as with . Do not conclude that every zero derivative must mark a change from increasing to decreasing.
Connect the algebra back to the original curve
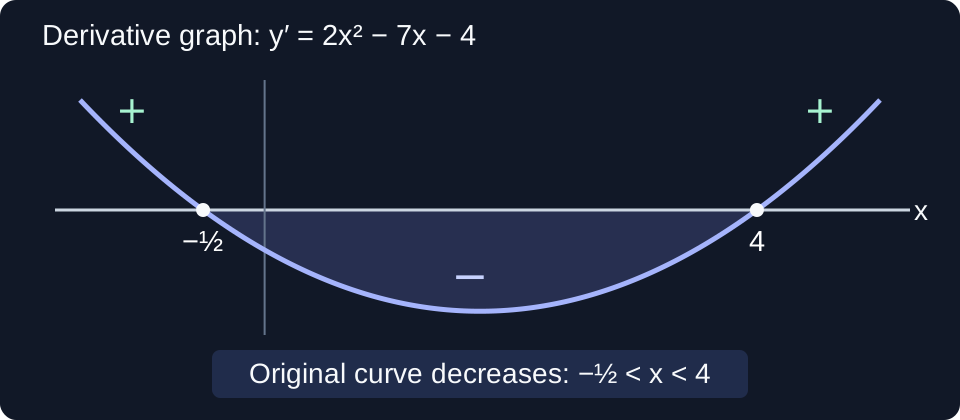
After solving the inequality, describe the movement in words. In the example, the original cubic rises before x = −1/2, falls between −1/2 and 4, then rises again. The diagram shows the derivative, not the cubic. Its section below zero identifies where the original curve has a negative tangent gradient. Keeping those two graphs separate helps prevent a common interpretation error.
Worked example: a cubic curve
Common Mistakes
- Solving y < 0 instead of dy/dx < 0.
- Reporting only the stationary x-values instead of the interval between them.
- Assuming a zero derivative always means a maximum or minimum.
- Including endpoints even though the question asks for a strictly negative gradient.